Quarterly Considerations Q1 2026

Project Finance Trends
Record Tax Capital Supply in 2025 – and the Mix Has Shifted
The combined tax equity and tax credit transfer market grew to an estimated $45-50 billion in 2025, representing roughly 10% year-over-year growth.1 The headline figure, however, is less important than what is happening to the underlying mix of this supply. Two structural shifts are reshaping how tax capital is being deployed in 2026.
First, the One Big Beautiful Bill Act (“OBBBA”) enhanced the value of 45Q and 45Z tax credits, while creating a longer phaseout period for 45X credits, expanding the universe of investors interested in these emerging technology credits. As a result, an estimated one-third of 2025 tax capital supply was deployed to sectors such as carbon capture, clean fuels, and advanced manufacturing. Traditional renewables remained a significant component of the market, with solar, storage, and wind accounting for approximately $35 billion of deployment.1 However, the investor base is broadening in ways that increase competition for capital across energy transformation.
Second, following the passage of the Inflation Reduction Act, CG/ CRC-IB anticipated that transferability would reshape how tax capital is deployed. In 2025, approximately 70% of transactions included a tax credit sale component, reflecting the emergence of hybrid structures combining tax equity or preferred equity with transferability as a standard structure.1 These structures enable investors to deploy finite tax capacity more efficiently while providing sponsors with greater flexibility in structuring their capital stacks.
In 2025, CG/ CRC-IB facilitated the sale of over $1.7 billion of tax credits and over $3.4 billion in tax equity capital.
Long-Awaited FEOC Guidance Released
On February 12, 2026, the IRS released FEOC guidance (Notice 2026-15), giving solar and storage project owners a more workable compliance path. The guidance allows the Material Assistance Cost Ratio (“MACR”) to be calculated based only on whether suppliers of project components listed in the familiar domestic content tables are a Prohibited Foreign Entity (“PFE”), removing the burden to trace PFE involvement upstream to polysilicon and wafers for solar and to cell components for storage. Since roughly two-thirds of the 66GW of operational wafer manufacturing capacity outside of China is owned or controlled by Chinese entities, requiring tracing to that level would have significantly constrained FEOC-compliant module availability. There is likely sufficient non-PFE cell manufacturing capacity to supply the U.S. market – over 167GW of operational cell facilities exist outside China, with more than half owned by non-Chinese companies – though existing or potential AD/CVD duties could make these cells more costly.2
For manufacturers claiming 45X credits, the bar is higher. They must calculate their MACR based on PFE status across all constituent materials in the supply chain. For example, with over 90% of solar-grade polysilicon produced in China, solar equipment manufacturers require significant diligence of supply chain sourcing and verification to maintain eligibility for 45X credits. Additionally, 99% of LFP cathodes and 97% of LFP anodes are produced by Chinese manufacturers, which may present similar challenges for domestic storage manufacturers.2 The practical result of this is a two-speed market: safe-harbored credits are expected to achieve stronger pricing and carry lower perceived risk than credits requiring bespoke cost tracing. Clarity on PFE distinctions and effective control definitions remains outstanding, and until that guidance arrives, sponsors should expect investors to apply conservative assumptions and conduct extensive independent diligence.
The Safe Harbor Sprint is in its Final Stages
The OBBBA created a defined window and a corresponding sense of urgency for developers to lock in tax credit eligibility. Projects that begin construction before July 4, 2026 have up to four calendar years to reach placed-in-service status; projects that miss the deadline can still claim credits only if placed in service by December 31, 2027 – a timeline that is generally difficult to achieve given the typical three-year utility-scale development cycle.
Adding further pressure, projects safe harbored after January 1, 2026 must comply with material assistance restrictions. Given that FEOC guidance wasn’t released until February, developers rushed to safe harbor as many projects as possible before the end of 2025.
The scale of safe harboring activity underscores the speed of industry response. According to Wood Mackenzie, between 216 and 240GW of utility-scale solar capacity will be safe harbored by the July 4th deadline. Approximately 61% of that capacity was secured before the OBBBA became law, suggesting that developers anticipated a phaseout under a new administration and moved aggressively to lock in projects under IRA rules well in advance.
By the end of 2025, an estimated 86% of expected safe harbor capacity had been secured ahead of the FEOC effective date.3 While not all of this pipeline will materialize (for example, some projects may face interconnection bottlenecks), the message is clear: the industry adapts quickly to change, and developers who moved early and decisively are best positioned to capture value over the near-term.
Project Finance Debt Continues to Diversify
The project finance debt landscape has been reshaped by the expansion of private credit into clean energy. Prior to 2020-21, development capital loans and warehouse facilities were largely unavailable to project developers; that has changed meaningfully. Multi-year warehouse facilities with front leverage have emerged as financing tools, allowing sponsors to access debt against future tax credit streams at a lower cost of capital. Developers are increasingly seeking structured debt facilities, including warehouse, equipment, and development revolvers, to fund ongoing operations, development, and construction costs, secured by both asset collateral and balance sheet. The range of available capital solutions is wider than in prior periods.
Across the broader clean energy sector – spanning renewables, LNG, digital infrastructure, and gas-fired generation – North American debt volumes reached approximately $260 billion in 2025, a 41% year-over-year increase, and new entrants, including banks, real estate lenders, ABS platforms, and private credit funds, continue to expand the lender universe.1 Yet the expansion of leverage has created its own challenges: the slowdown in M&A activity, combined with developers navigating a new policy era, has left some companies with elevated leverage and facing pressure to service near-term debt maturities. As the July 4th safe harbor deadline accelerates construction timelines and fund-life constraints push LP-backed platforms toward exits, CG/ CRC-IB believes 2026 may test whether the current depth of lending liquidity can absorb a wave of simultaneous refinancing and monetization activity.
M&A Trends
From Selective to Strategic: How the Market Has Evolved
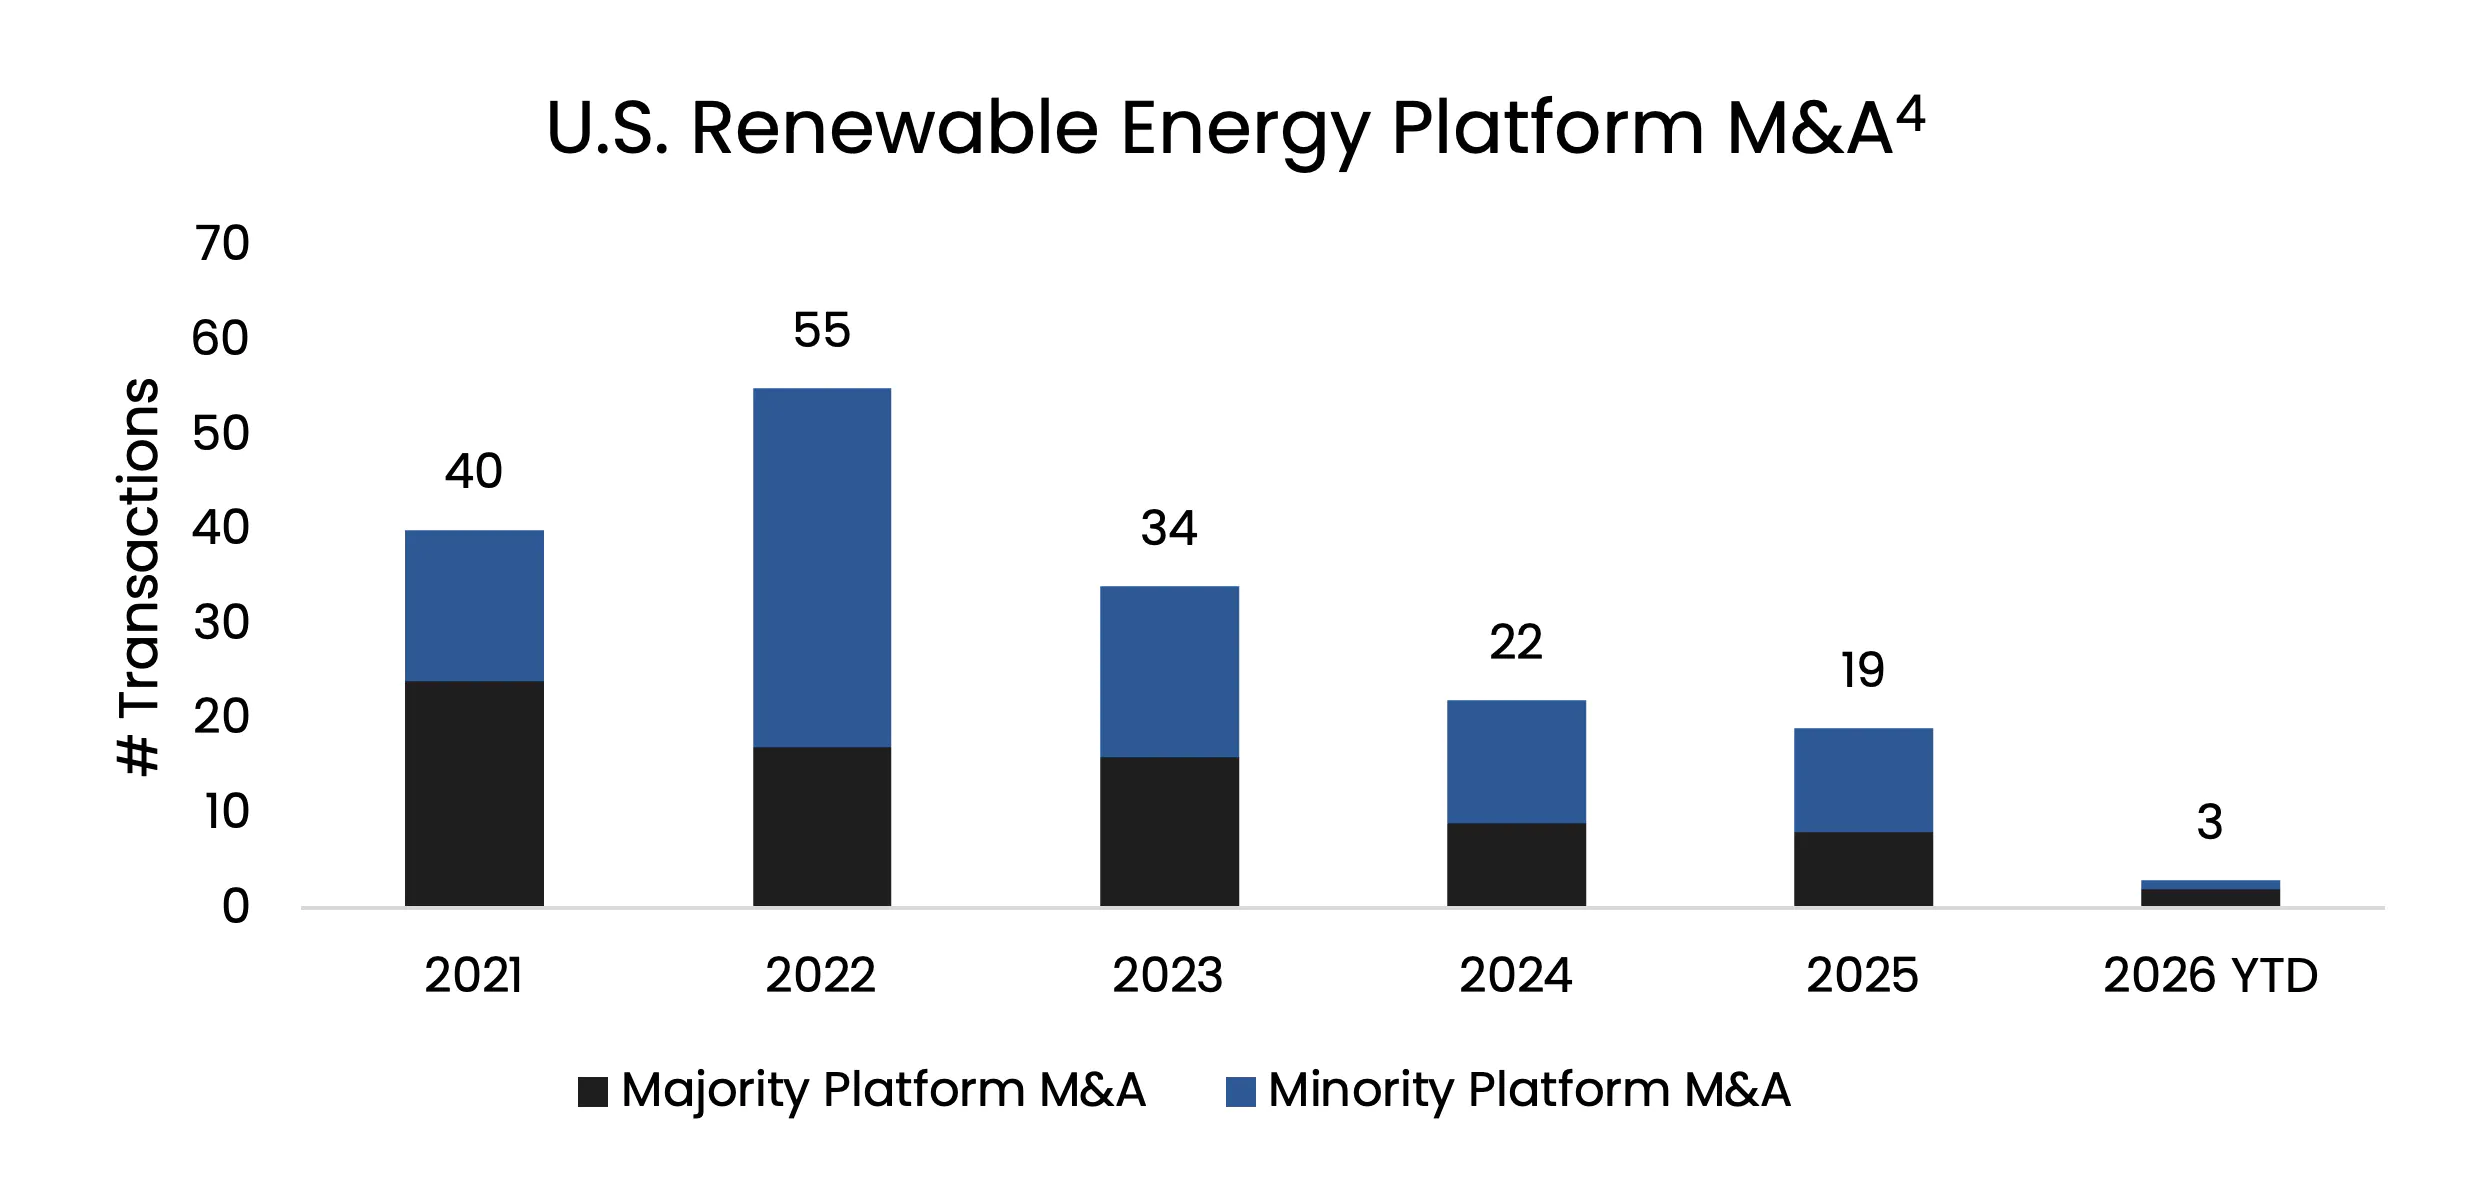
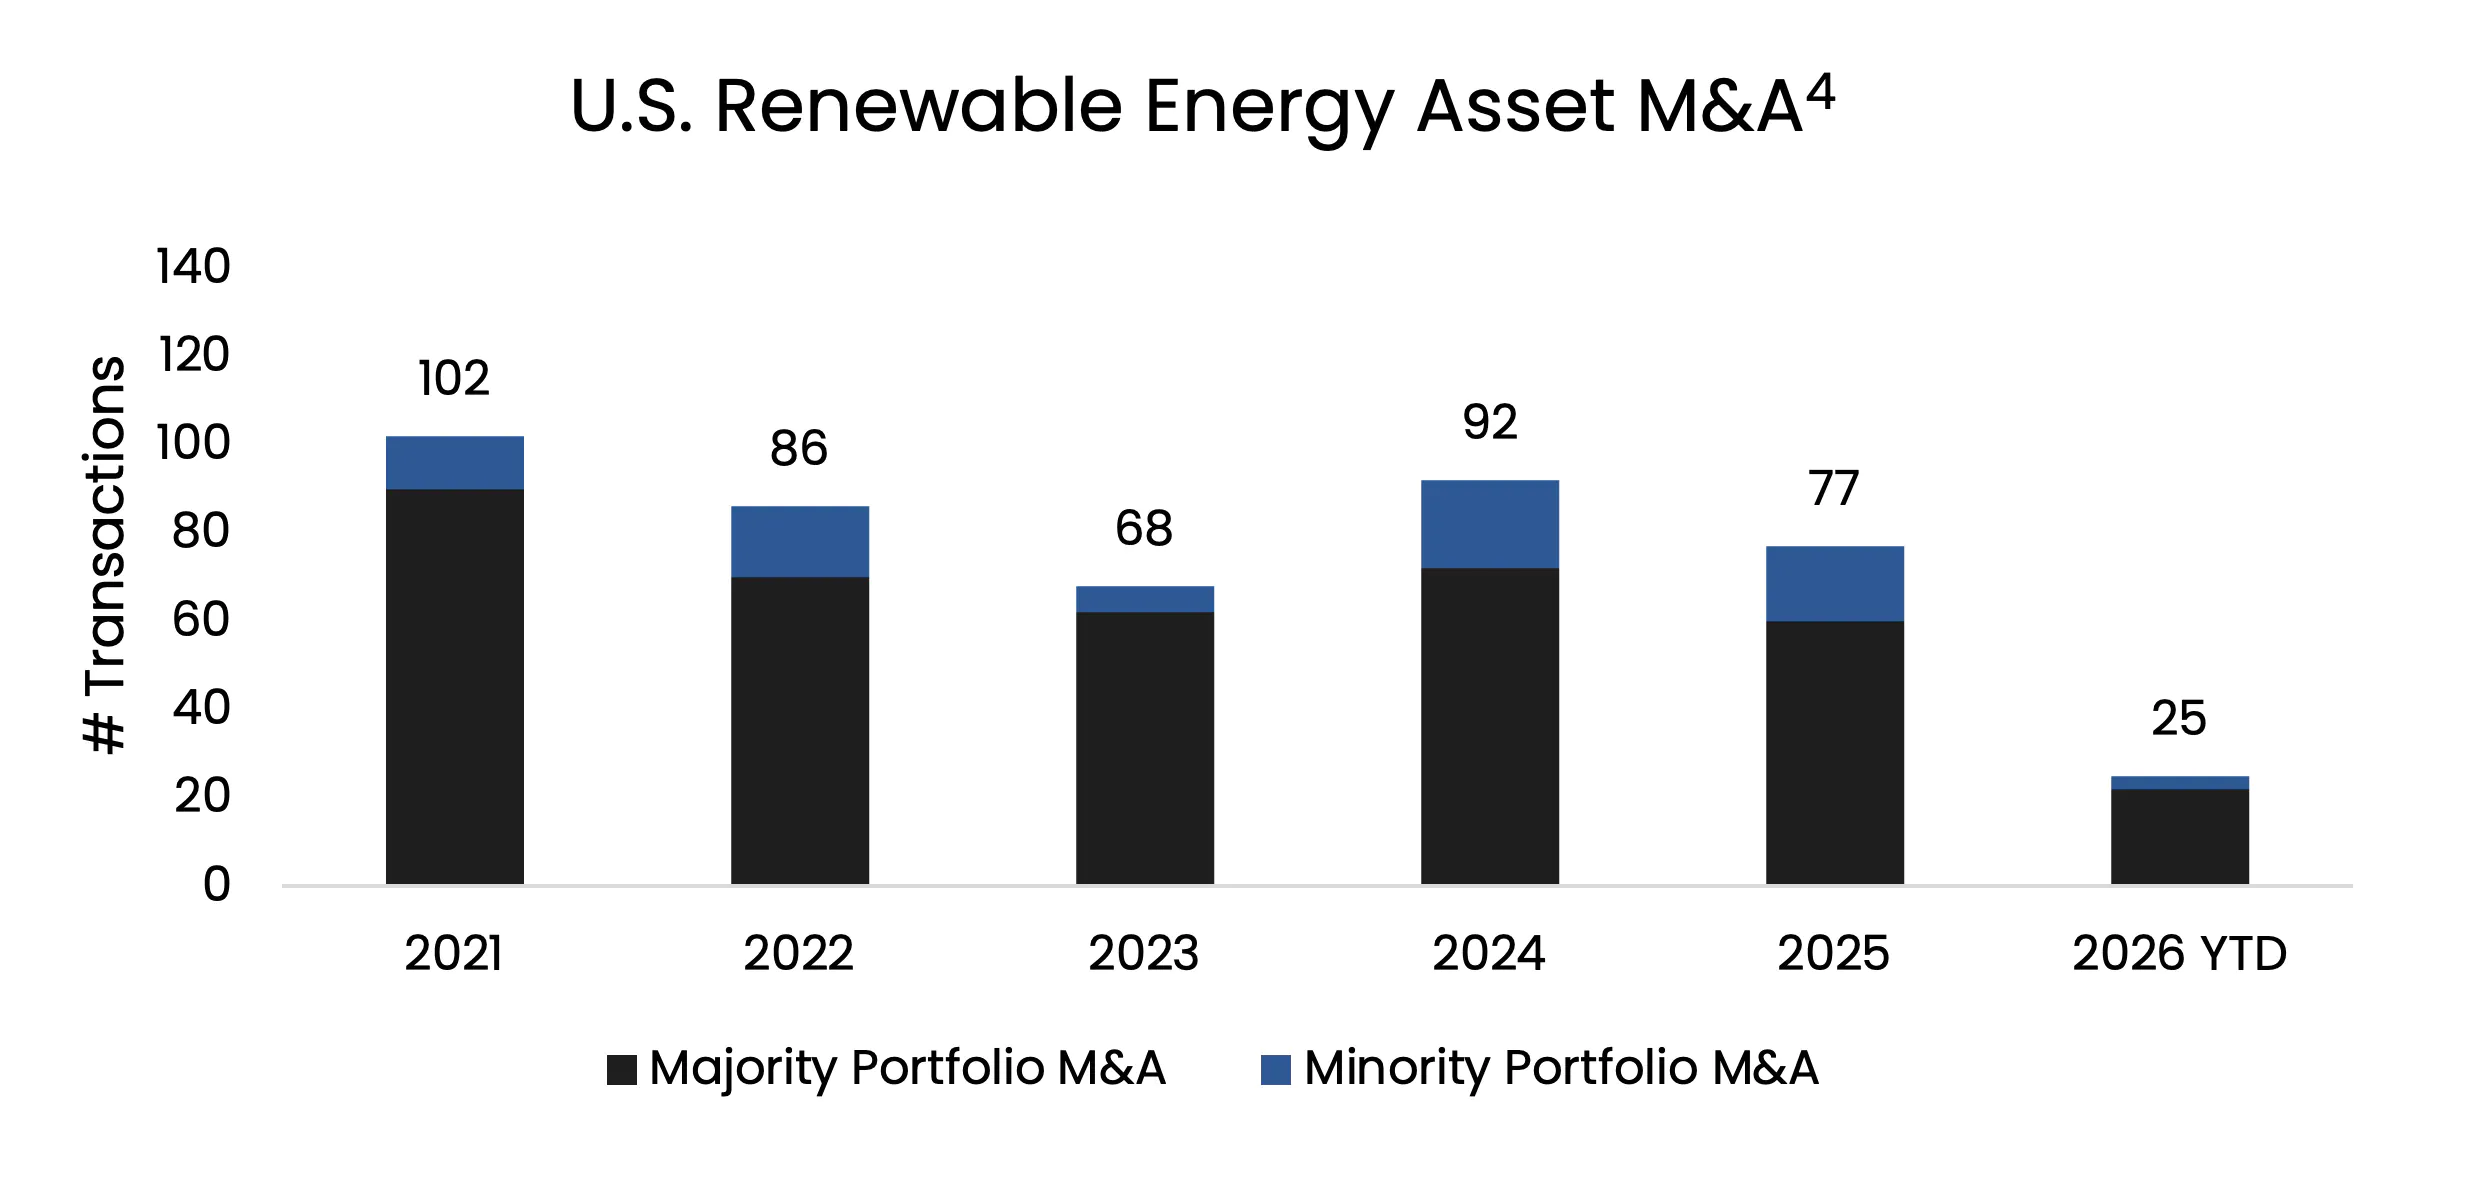
A total of 96 publicly reported renewable energy asset-level and platform transactions closed in 2025, a 16% decline from 2024, reflecting a measured slowdown rather than a retreat from market engagement.4 The more significant development is not the volume, but how capital is being deployed. Rather than pursuing outright acquisitions, investors are increasingly turning to strategic partnerships, joint ventures, and selective co-investment structures to manage growing policy divergence, tariff uncertainty, and tighter financing conditions. The playbook has shifted from “acquire the platform” to “partner with the execution team,” allowing buyers to gain exposure to high-quality pipelines while sharing development risk and preserving balance sheet flexibility.
This is a meaningful departure from the prior cycle, where financial sponsors sought majority control and full platform ownership. While investors are still pursuing such investments, the most active buyers today are deploying capital through preferred equity and structured solutions that sit alongside sponsor equity rather than replacing it. Deal structures are evolving accordingly, with buyers shifting risk to sellers through milestone-based payments rather than paying full NTP value upfront, risk transfer occurring later in the development cycle, and sponsors pursuing partial equity sell-downs, asset-level monetization, and staged exits to bridge residual valuation gaps.
For developers, this creates new paths to liquidity without requiring a full exit. For buyers, it allows disciplined entry or further diversification into a market where execution risk remains elevated and policy clarity continues to evolve.
The public markets are also re-emerging as a viable exit path: energy-related IPO deal proceeds grew from roughly $650 million in 2024 to nearly $3.8 billion in 2025, and CG/ CRC-IB believes this trend may continue in 2026.5
Forced Liquidity is Reshaping the Seller Landscape
The supply side of the M&A market is undergoing its own structural shift. Many LP-backed platforms are approaching fund-life constraints that will likely require exits in 2026. Some sponsors and their investors may consider continuation fund structures given the number of platforms that are anticipated to enter the market, but these vehicles are not available to all GPs and add complexity that not every LP base will support.
CG/ CRC-IB is observing a broader pattern: sponsors that built oversized development pipelines during the low cost of capital era are now rationalizing those portfolios, and developers with large safe-harbored pipelines that they cannot fully finance or build within the four-year window may pursue selective asset sales. The result is a growing volume of assets coming to market not as part of a deliberate strategy, but because the sponsors behind them have reached the limits of their capital, execution capacity, or both.
The distinction matters for pricing. A developer selling under pressure typically clears at a different multiple than one selling opportunistically. The urgency created by the OBBBA deadline and rising electricity demand is compressing decision timelines on both sides of the table, and CG/ CRC-IB believes this dynamic may contribute to an increase in transaction volume in the second half of 2026. Meanwhile, investors are anchoring valuations to contracted, stable cash generation rather than growth narratives or speculative pipeline value – the growth story still matters, but it must be underpinned by near-term, visible revenue. For buyers with conviction and available capital, the opportunity set is expanding – but the diligence burden is increasing in parallel, as the quality variance among available assets widens.
CG/ CRC-IB is actively advising on several sell-side asset and platform M&A mandates across development stages, technologies, and various ISOs. Please contact our team for additional information.
The High Premium on Execution
One of the less visible dynamics in the current M&A market is the scarcity of late-stage, execution-ready assets. Across renewables, projects that are genuinely shovel-ready – permitted, interconnection-secured, and equipment procured – are in short supply relative to the volume of capital seeking deployment.
In solar, developers are expected to safe harbor a substantial amount of capacity prior to the July 4th deadline, but only a fraction of that has cleared interconnection, secured equipment, and arranged financing. In wind, a significant share of queued projects may be considered non-viable due to tax credit phaseouts, permitting headwinds, and equipment cost inflation.
Assets that have navigated those challenges are generally positioned to command more favorable terms. Major turbine OEMs are quoting 24 to 36-month lead times for new orders, making late-stage wind assets with secured turbines and permitted sites relatively scarce.
The takeaway is consistent across technologies: the bid today is for execution, not pipeline.
Distributed generation is emerging as a parallel consolidation story. Operating DG portfolios with contracted cash flows are transacting at tighter spreads and, in some cases, at premiums, as investors draw a sharper distinction between development-risk platforms and operating businesses.
The market is placing greater emphasis on execution over optionality, and sponsors that can demonstrate team depth, delivery track record, and contracted revenue are generally better positioned in an environment where those attributes are in relatively short supply.
CG/ CRC-IB’s Recently Completed Transactions
| Counterparty | Sponsor | CG/ CRC-IB Role | Date | Transaction Synopsis |
| Confidential | Confidential | Exclusive Financial Advisor | 3/2026 | Pref Equity Investment for 90MW DG Solar Portfolio |
| Stonehenge Capital, ING Capital, NORD/LB | Heelstone Renewable Energy | Financial Advisor to Sponsor | 3/2026 | Tax Equity & Debt Financing for 102MW Utility-Scale Solar Project |
| First Citizens Bank, MUFG, ING Capital, National Bank of Canada, Franklin Park | Dimension Energy | Exclusive Financial Advisor | 3/2026 | Tax Equity & Debt Financing for 132MW Community Solar Portfolio |
| Confidential | Confidential | Exclusive Financial Advisor | 1/2026 | Class A Debt Financing for 281MW Utility-Scale Solar Project |
| Confidential | Viridi Energy | Exclusive Financial Advisor | 1/2026 | ITC Transfer for Landfill RNG Project with 345,000 MMBtu / yr of Production |
References
- Norton Rose Fulbright: Cost of Capital: 2026 Outlook
- Wood Mackenzie: Interim FEOC guidance: Impacts on US storage and solar markets, February 20, 2026
- Wood Mackenzie: The state of safe harboring: A strategic outlook for US utility-scale solar development, March 17, 2026
- Announcements tracked via Infralogic (part of Ion Analytics) and available press releases through March 2026
- EY: 2025 US IPO activity fuels confidence for 2026, January 28, 2026