Quarterly Considerations Q1 2024
M&A Trends
A strong Q1 for renewables asset M&A.
Q1 ’24 saw the highest quarterly transaction volume for renewable energy asset and portfolio M&A since 2021. Easing supply chains, greater clarity around the Inflation Reduction Act (IRA), and a growing developer appetite for liquidity are key factors driving this increase. Well-capitalized buyers with robust balance sheets and corporates in pursuit of decarbonization strategies continue to opportunistically invest and acquire assets utilizing creative structuring solutions.
International strategics seeking to expand their U.S. presence, along with institutional investors including pension and infrastructure funds, continue to show interest in acquiring passive interests or partial stakes in assets. Investors are showing increased willingness to commit to projects at various stages from development through operations. Sponsors are similarly viewing interest sell-downs as an effective strategy to recycle cash for new development activity and to partially monetize gains on their existing asset base. In some cases, if the structure provides for joint control, these transactions serve as deconsolidation tools for IPPs that are sensitive to debt covenants, especially under International Financial Reporting Standards (IFRS) where tax equity is classified as debt alongside traditional project debt.
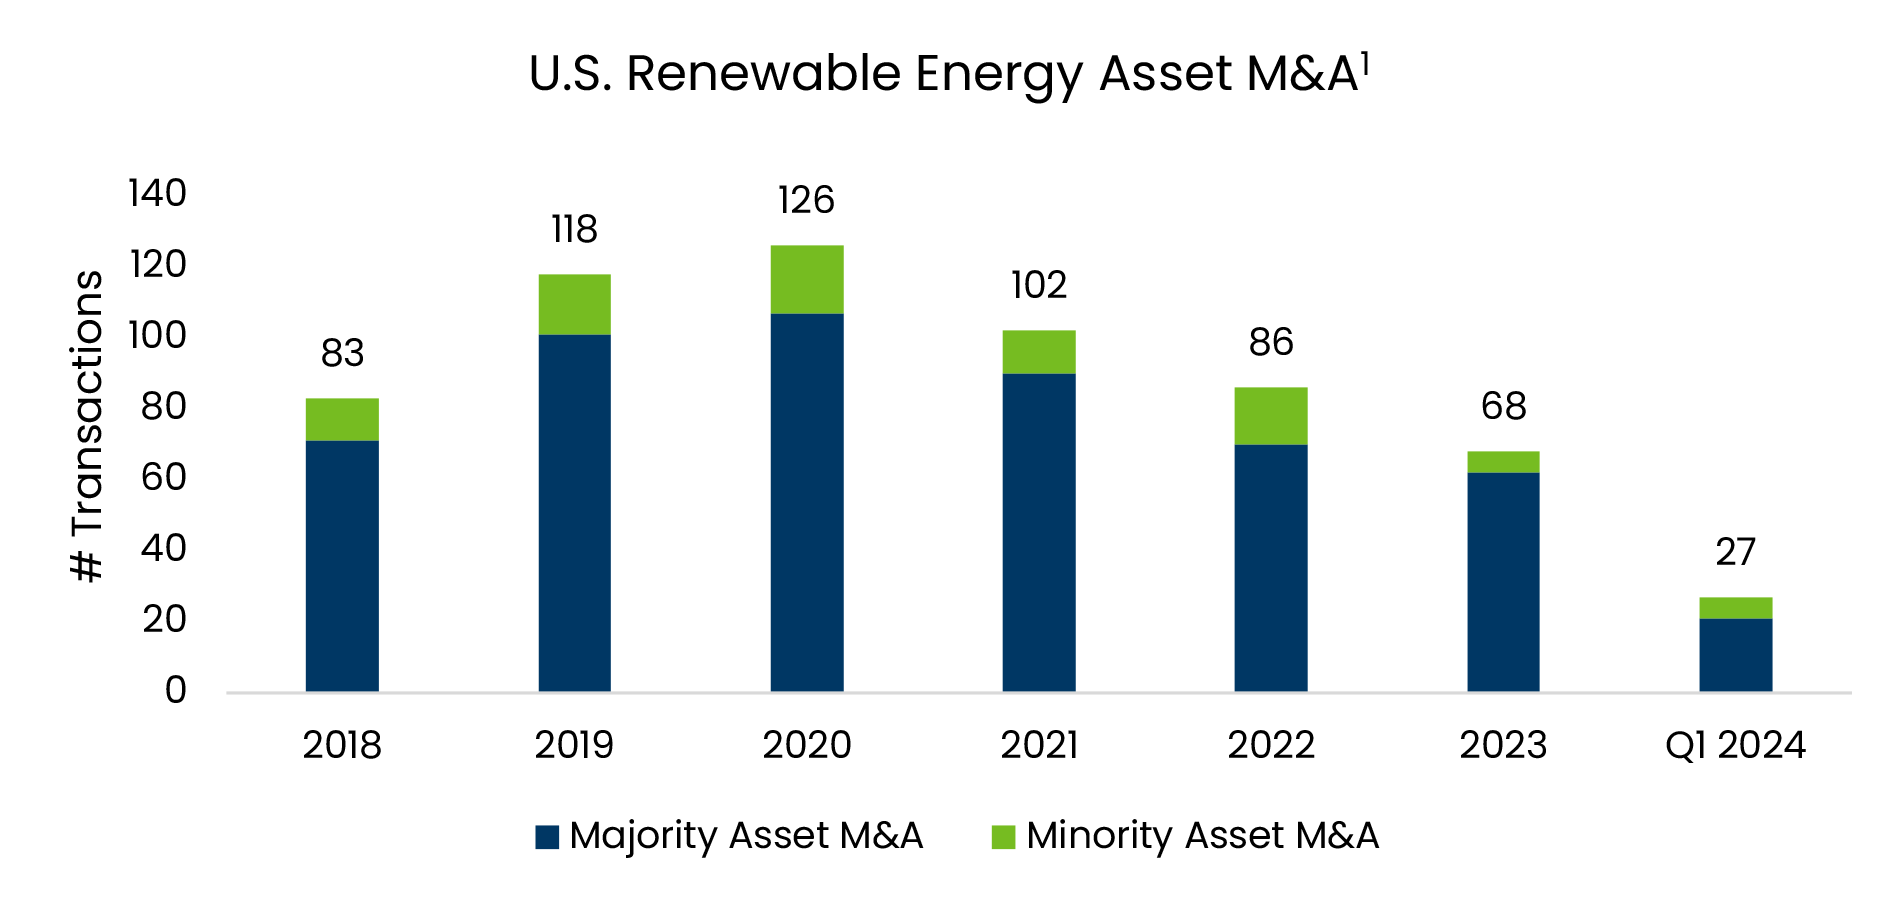
Renewable energy developers, who previously focused on developing or acquiring as many projects as possible, are now reallocating their time and funds to fewer, more strategically positioned projects. This shift is a response to rising interconnection deposit requirements and queue delays. CRC-IB expects a market normalization where respected sponsors and emerging developers with strong projects will be first up to transact. While the market may not see record high transaction volumes like in 2020, we expect projects with strong line of sight to operations to receive higher valuations.
Platform M&A remains lackluster but should begin to improve within the next 6-9 months.
CRC-IB tracked 32 renewable energy platform-level investments in 2023, down 42% over 2022. Both volume and pricing experienced declines, while a higher cost of capital driven by elevated interest rates and widening margins diminished potential returns. Minority stake corporate investments were responsible for a large percentage of this decrease, with majority stake or complete acquisitions falling 12% over the same period.1 We have seen four platform transactions close in Q1 ‘24 and expect increased market activity over the next two quarters as bid-ask spreads shrink and buyers re-engage as macroeconomic conditions stabilize after the past 18 months of volatility.
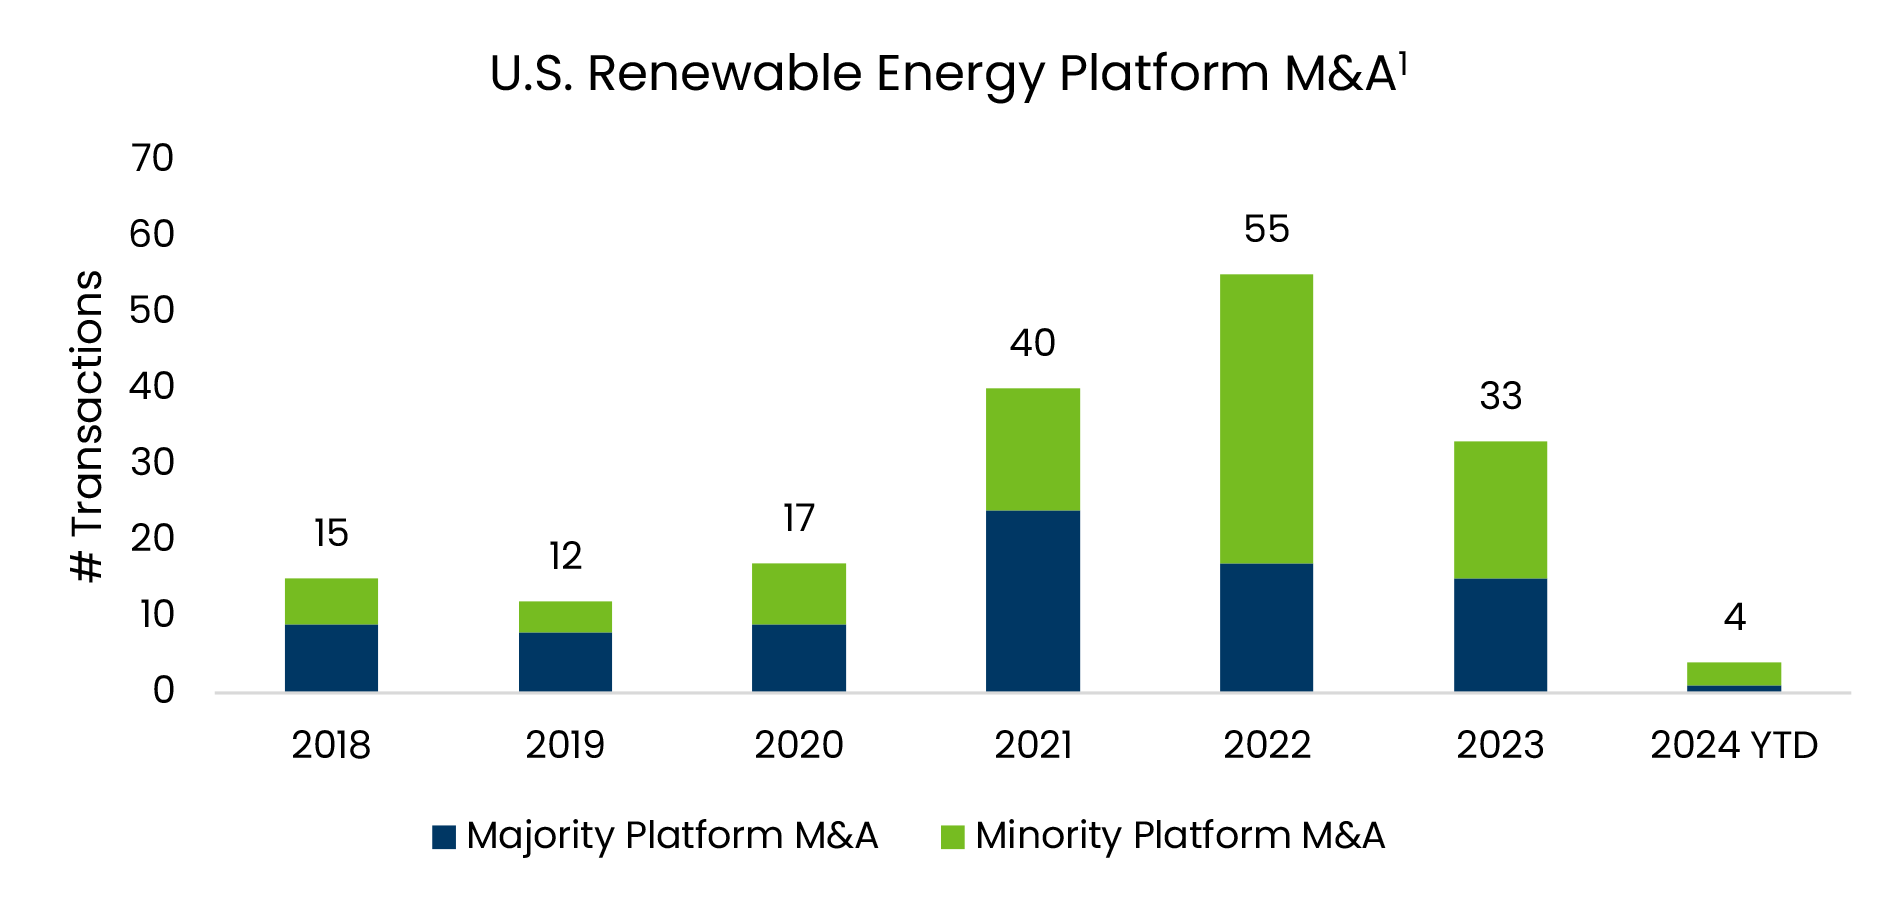
Independent developers and utilities continue to search for platforms to increase their scale, add development projects to their pipelines, and enter new geographies and technology markets. With longer term tax credit certainty, strong state policies, and proven renewable technologies, newer entrants, like oil and gas majors and financial institutions, are increasingly showing interest in adding capabilities and expanding their value chains through platform acquisitions. Moreover, as asset M&A competition increases, buyers are increasingly focused on acquiring platforms with strong greenfield origination capabilities or entering into strategic agreements that provide pipeline exclusivity.
Sponsors are utilizing various sources of development capital.
- Platform capital raises have emerged as a popular choice for developers who have yet to transact and are seeking to raise capital to support pipeline growth, selling, general, and administrative (SG&A), and working capital needs. This is especially suitable for smaller developers who are more heavily impacted by increased costs and project delays.
- Structured or preferred equity solutions are increasingly attractive to sponsors aiming to transition assets from development to operational phases. Although preferred equity investors may not benefit as much from the upside, their risk is mitigated by their “higher-in-line” status compared to common equity investments, making these structures appealing.
- Joint Development Agreements (JDA): Strategic buyers are leveraging the high cost of capital to increase their asset base by entering into longer-term JDAs with sponsors. These agreements also benefit developers, allowing them to access capital while retaining the potential for upside as projects reach critical development milestones.
- Pre-NTP development loans: An increasing number of entities, such as private credit and ESG funds, as well as boutique finance groups, are offering this highly sought-after product. In these structures, alignment between the sponsor and lender is crucial, encompassing aspects such as the development timeline, potential delays, future project income, and risk mitigation strategies. The pricing on pre-NTP development financing currently sits around SOFR + 375-600bps, partially dependent on development stage, sponsor, and the availability of operating projects that may be pledged as collateral.2 Additionally, most lenders will have minimum MOIC requirements that may increase the overall cost of capital depending on the tenor of the agreement.
Project Finance Trends
The cost of capital has stabilized in recent months. However, tax and debt capital remain more expensive than 6-12 months ago.
- Tax Equity Yield-Based Flips: 8.0-9.0%
- Tax Equity Calendar-Dated Flips: 1.14x-1.25x MOIC
- Transfer Pricing: $0.89-$0.95 (gross)
- Term Debt: SOFR + 175-200bps3
Pricing is highly dependent on technology type, sponsor profile, and project revenues. Yields are expected to remain relatively stable throughout 2024. We anticipate a lag in the reduction of yields while the Federal Reserve contemplates rate cuts. For borrowers, the regional banking crisis in 2023 led to a minor contraction in the lending market, resulting in wider credit spreads. Private credit has stepped in to fill this gap, and liquidity has since stabilized.
Tax capital volume was strong in 2023.
Total 2023 tax capital supply is estimated to have been $25Bn, consisting of $21Bn of traditional tax equity (up $3Bn from 2022) and $4Bn of tax credit transfers. The increase was due to several factors, including the introduction of transfer structures, transactions from 2022 delayed into 2023, and several outsized multi-asset deals that closed last year.2 CRC-IB expects 2024 tax capital demand to be just under $40Bn, with carbon capture, utilization, and storage (CCUS) and other low-carbon technologies requiring significant investment. The U.S. CCUS market alone is expected to grow 5x over the next five years, based on announced projects.4 It is likely that this year’s supply will increase in the single-digit billions, but there is continued uncertainty about when annual supply will meet growing demand.
Various tax capital structures are increasing market liquidity.
In addition to pure tax credit transfers, two additional structures are gaining popularity.
- Tax Equity Hybrid / Tax T-Flip:
- Overview: The sponsor forms a partnership with a tax equity investor who monetizes the tax benefits provided by the project’s accelerated depreciation. Many of the elements mirror traditional tax equity, but all or a portion of the tax credits are sold to a third-party buyer, with the sale proceeds allocated per a negotiated agreement between the sponsor and the tax equity investor. This structure is being put forth by after-tax investors who are typically already active in tax capital investing.
- Benefits:
- Allows after-tax investors to participate in more transactions by reducing the tax intensity of each investment, thereby better spreading their tax capacity
- Transfer element provides additional flexibility in structuring income allocations, potentially enabling the use of Modified Accelerated Cost Recovery System (MACRS) on transactions that might otherwise be too DRO-heavy for most investors
- Comfort with investment structure due to similarities with traditional tax equity investments
- Drawbacks:
- Transferred ITC can receive a lower valuation than when monetized dollar-for-dollar by the tax equity investor
- Requires a separate transaction to transfer tax credits
- Cash Equity Hybrid / Cash T-Flip:
- Overview: New or existing investors are offering structured equity investments with a target pre-tax return prior to flipping down the cash share. The sponsor forms a partnership with this investor, and the parties split the project’s cash distributions per a negotiated agreement, typically allocating the project’s taxable income/losses on a pro-rata basis. The partnership typically sells 100% of the tax credits to a third party under a tax credit transfer transaction.
- Benefits:
- Allows for the sponsor to generate a basis step-up to FMV prior to transferring the tax credits
- Income allocations can allow sponsors to offset a portion or all of the gain on sale associated with the step-up, depending on the characterization of that gain
- Drawbacks:
- Similar drawbacks to the Tax Equity Hybrid structure with the potential addition of not efficiently monetizing depreciation benefits
Domestic manufacturing should increase, but it will take time.
The IRA introduced a 10% Domestic Content tax credit adder for projects where 40% of the cost of manufactured products originated from the U.S. and 100% of iron and steel used was domestically produced. Sponsors are having a somewhat difficult time qualifying for this incentive for two reasons. First, developers must ask their manufacturers for the direct costs of making the components, but some non-US companies may be unwilling to provide this information. Consequently, developers must use the price paid for imported components, which is likely materially higher than the manufacturer’s, thereby inflating the percentage of non-US manufactured products. Second, domestic manufacturing is currently ill-equipped to meet the sudden increase in demand for renewable energy project components. It will be some time before the supply can meet the demand; for instance, constructing a cell factory for domestically made cells can take 2-3 years.
In 2023, several large solar manufacturers announced new investments in U.S. facilities. While some of these companies previously contemplated facilities in Europe or Asia, the IRA offered economic rationale for growing in the U.S. According to SEIA, solar companies have committed ~$20Bn for domestic PV manufacturing, which includes 85GW of panel capacity, 43GW of cells, and 20GW of silicon ingots and wafers.5 This is a large shift from 2022, when the U.S. had no ingot, wafer or cell manufacturing capacity and imported ~23GW of modules. With increased supply, we expect costs to decline. According to Wood Mackenzie, U.S. panel costs must reach less than a 4-5c/W premium over imported panels for the bonus adder to make economic sense. Currently, the premium sits as high as 15c/W.6 CRC-IB expects manufacturing investments to grow and the number of U.S. companies that can meet tax credit requirements to increase in the not-too-distant future.
CRC-IB’s Recently Completed Transactions
References
-
- Announcements tracked from inframationnews.com and available press releases through March 2024
- Norton Rose Fulbright Cost of Capital 2024 Outlook
- Internally collected data from CRC-IB and conversations with market participants in Q1 2024
- Wood Mackenzie North America Power Tool (Note: the tax credit demand forecast is based on Wood Mackenzie’s buildout by technology type and CRC-IB’s assumptions for CapEx and production.)
- S&P Global: US solar industry navigates ‘growing pains’ as power sector leader, September 20, 2023
- Wood Mackenzie: IRA update: Winners and losers from domestic content guidance, May 22, 2023